The J curve is one of the most frequently used concepts to describe the performance dynamics of a private equity fund.
Private Equity: Everything you need to know about private equity
Private equity is a key asset class in supporting the growth of unlisted companies. By providing long-term capital and strategic support, private equity contributes to the development, transformation, and value creation of SMEs and mid-cap companies. Understanding its mechanisms, performance, and risks is essential to assessing its role in long-term asset allocation.
This article has been automatically translated. Please excuse any inaccuracies or translation errors.
Dieser Artikel wurde automatisch übersetzt. Bitte entschuldigen Sie etwaige Ungenauigkeiten oder Übersetzungsfehler.
This article has been automatically translated. We apologize per inaccuracies or translation errors.
Understanding the concept of the J-curve
The J-curve refers to the pattern typically observed in the cumulative performance of a private equity fund over its lifetime. In the early years, the net value of the fund and cash flows mainly reflect capital outflows.
Capital outflows are related to fund calls and expenses, while the underlying assets have not yet generated distributions.
Gradually, the trajectory shifts as the companies in the portfolio grow, their valuations evolve, and the first liquidity transactions are carried out.
This representation is inseparable from the very nature of private equity.
Unlike listed assets, which are valued continuously and determined by the market, unlisted assets are valued periodically. Their valuation is based on conservative assumptions and operational data observed over time.
Value creation is based on structural transformations that take several years to produce results.
Example of the J-curve of a private equity fund
The mechanisms behind the J-shape
The characteristic shape of the J-curve can be explained by several structural mechanisms specific to private equity funds.
Firstly, the commitments made by investors during the fundraising process are not invested immediately. Capital is called in gradually, as opportunities are identified by the management company, which generates outflows spread over time.
At the same time, fund management fees begin to apply from the early years, regardless of the pace at which value is created by the investments.
This temporal asymmetry between immediate costs and deferred benefits contributes to the initial negative phase of the curve.
Finally, value creation itself is inherently deferred. Operational transformation plans, growth or consolidation strategies, and governance improvements take time to translate into valuation or liquidity. This time lag is central to the economic logic of private equity.
A phenomenon specific to illiquid assets
The characteristic shape of the J-curve can be explained by several structural mechanisms specific to private equity funds.
Firstly, the commitments made by investors during the fundraising process are not invested immediately. Capital is called in gradually, as opportunities are identified by the management company, which generates outflows spread over time.
At the same time, fund management fees begin to apply from the early years, regardless of the pace at which value is created by the investments.
This temporal asymmetry between immediate costs and deferred benefits contributes to the initial negative phase of the curve.
Finally, value creation itself is inherently deferred. Operational transformation plans, growth or consolidation strategies, and governance improvements take time to translate into valuation or liquidity. This time lag is central to the economic logic of private equity.
J-curve and fees in private equity
Private equity is a key asset class in supporting the growth of unlisted companies. By providing long-term capital and strategic support, private equity contributes to the development, transformation, and value creation of SMEs and mid-cap companies. Understanding its mechanisms, performance, and risks is essential to assessing its role in long-term asset allocation.
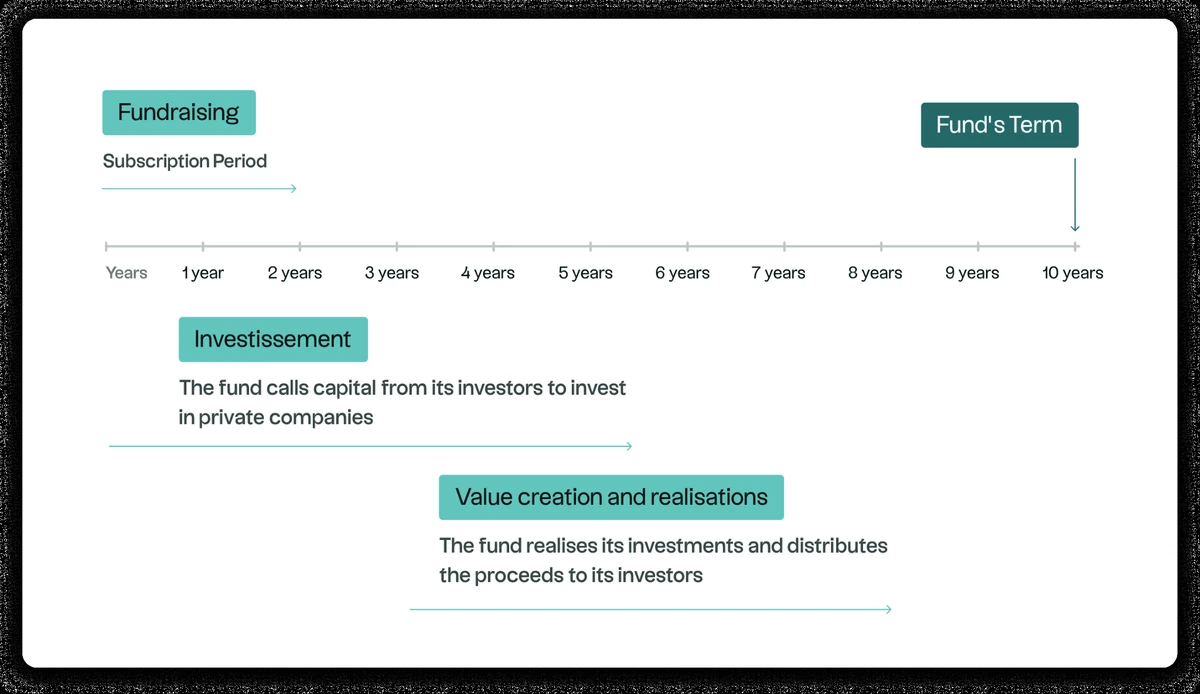
The J curve is part of the classic life cycle of a private equity fund, structured around several successive phases.
Phase 1
The first phase corresponds to fundraising, during which investors commit to a target amount. This commitment does not constitute an immediate investment, but rather a promise to make capital available over the life of the fund.
Phase 2
Next comes the investment period, which generally lasts three to five years. During this phase, the management company identifies opportunities, conducts in-depth analyses, structures transactions, and gradually builds up the portfolio. Calls for funds are made as investments are made.
Phase 3
The next phase is value creation. Management teams provide strategic, operational, and financial support to portfolio companies. This period is often the longest and most decisive, but also the least visible in terms of cash flow.
Phase 4
Finally, divestments occur when companies reach a certain level of maturity or when market conditions allow. Distributions to investors then begin to offset, and then exceed, the capital called, giving the curve its characteristic upward slope.
Illustrative diagram of the life cycle of a private equity fund
Why are performances often negative at the beginning?
The initial negative phase of the J-curve is mainly explained by the structure of cash flows. The early years are dominated by capital calls needed to build the portfolio, while distributions are non-existent or marginal.
Added to this is a cautious approach to valuing investments. At the beginning of the cycle, recently acquired companies have a limited track record under the new governance, which generally leads to conservative valuations.
This accounting conservatism contributes to a performance that appears lower than the underlying economic reality.
Finally, the time lag between the initial investment and the completion of the first disposals explains why value creation is not immediately reflected in performance indicators.
The fundamentals of value creation in private equity
Value creation in Private Equity
Private equity relies on structural value creation drivers that are specific to this asset class and implemented over the long term. In this video, Louis Flamand, Chief Investment OfficerAltaroc, discusses the main mechanisms at work.
During the investment phase, cash flows are mostly negative, reflecting capital calls and expenses. Net asset value then begins to stabilize as portfolio companies gain visibility and initial operational improvements materialize.
The distribution phase marks a turning point. Disposal transactions generate inflows, which gradually reverse the fund's cumulative trajectory.
It is this sequence that gives the J-curve its upward shape.
However, this trend varies significantly depending on the strategy. Venture capital funds often have longer and more volatile investment horizons. buyout strategies, on the other hand, buyout to exhibit more consistent performance profiles due to more predictable operating cash flows.
These differences do not constitute standards and do not prejudge the final results.
Institutional interpretation of the J curve
The J-curve is a concept that private equity professionals understand perfectly, but one that is often misinterpreted outside of private equity. In this video, Louis Flamand discusses it based on real-life situations he has encountered throughout his career in fund management. This provides useful insight into how institutional investors really interpret a fund's performance in its early stages, beyond short-term indicators.
The analysis of the J-curve cannot be separated from the fundamental characteristics of private equity.
Structural illiquidity implies capital being tied up for several years, with no possibility of early exit under standardized conditions.
Performance dispersion across funds, strategies, geographic regions, and vintages is significant. It reflects the idiosyncratic nature of unlisted investments and dependence on the operational and strategic choices made by management teams.
The J-curve and the risks of private equity
The analysis of the J-curve cannot be separated from the fundamental characteristics of private equity. Structural illiquidity implies capital being tied up for several years, with no possibility of early exit under standardized conditions.
Performance dispersion across funds, strategies, geographic regions, and vintages is significant. Itreflects the idiosyncratic nature of unlisted investments and dependence on the operational and strategic choices made by management teams.
Performance differences by vintage, between quartiles
Finally, like any capital investment, private equity carries a risk of partial or total loss of the capital invested. These factors must be fully taken into account in any consideration of this asset class, within a framework tailored to the profile and objectives of each investor.
Conclusion: a temporal reading of private equity
The J-curve provides a useful framework for understanding the unique time horizon of private equity. It illustrates the lag between the initial investment effort and the realization of value creation, which is characteristic of long-term strategies.
However, it is neither a universal rule nor a promise of performance. Each fund follows a unique path, shaped by its strategy, execution, and environment.
Understanding this dynamic allows us to approach private equity with a more informed understanding of its mechanisms and constraints.
FAQ
What is the J-curve in private equity?
The J-curve refers to the cumulative performance of a private equity fund over its lifetime, marked by an initial phase that is often negative, followed by a gradual recovery as investments mature and exits occur.
Does the J-curve guarantee future performance?
No. The J-curve is a statistical observation derived from market practices. It does not constitute a guarantee or a forecast of the future performance of a private equity fund.
Why is performance negative at the beginning of a fund?
The initial negative phase can be explained by the gradual calls for funds, the management fees applied from the outset, and the time lag between the investment and the first distributions.
Do all private equity funds follow a J-curve?
No. Each fund has its own specific trajectory, influenced by its strategy, its vintage, the quality of its execution, and economic conditions. Some funds may never exhibit the theoretical J-curve shape.
What are the risks associated with private equity?
The main risks include high illiquidity, significant performance dispersion, dependence on economic cycles, and the risk of capital loss. These characteristics are inherent in unlisted investments.
Private Equity: Everything you need to know about private equity
Private equity is a key asset class in supporting the growth of unlisted companies. By providing long-term capital and strategic support, private equity contributes to the development, transformation, and value creation of SMEs and mid-cap companies. Understanding its mechanisms, performance, and risks is essential to assessing its role in long-term asset allocation.


.webp)


.webp)

_11zon.webp)